MongoDB Atlas provides a variety of monitoring features to help you keep your databases healthy and performant. Here are some of the key monitoring features offered by MongoDB Atlas:
- Metrics: MongoDB Atlas provides a set of system and database-specific metrics that allow you to monitor the performance and health of your databases. These metrics include CPU usage, disk I/O, memory usage, network traffic, and more. You can view these metrics in real-time through the Atlas web UI or access them programmatically using the Atlas API.
- Alerts: MongoDB Atlas allows you to set up alerts that notify you when certain metrics exceed predefined thresholds. You can set up alerts for various metrics, such as CPU usage, disk space, and network traffic. Alerts can be sent via email, SMS, or integrated with other notification systems.
- Visualizations: MongoDB Atlas provides a range of built-in visualizations that allow you to monitor the behavior of your database over time. These visualizations include charts for database operations, resource utilization, and query performance.
- Profiling: MongoDB Atlas allows you to enable the database profiler, which collects detailed information about the performance of database operations. You can use this information to optimize queries and identify potential performance issues.
- Real-time monitoring: MongoDB Atlas provides a real-time monitoring feature that allows you to track changes to your database in real-time. You can monitor operations, queries, and errors in real-time, allowing you to quickly identify and respond to issues as they arise.
There are several scenarios where using an enterprise monitoring solution like Prometheus may be beneficial. One such scenario is mentioned below
Centralized Monitoring: Integrating Prometheus with MongoDB Atlas allows you to monitor your database and other systems from a single location. This can simplify your monitoring workflow and provide a more comprehensive view of your infrastructure.
It provides a single view of all your metrics and logs across all your applications and platforms, making it easier to detect and troubleshoot issues.
In the next section we will see how to Integrate Prometheus with MongoDB Atlas and later create Dashboards in Grafana using the metrics captured from MongoDB Atlas
Prometheus
Prometheus is a free and open-source monitoring system that is widely used to collect, store, and analyze time-series data.Prometheus can monitor various types of systems and applications, including servers, databases, containers, and cloud services. It works by periodically scraping metrics data from the targets that it is configured to monitor. The collected data is stored in a time-series database and can be queried and visualized using the built-in Prometheus dashboard or other third-party tools.
Set up in Mac
You can install Prometheus on your Mac using the Homebrew package manager. Here are the steps
- Install Homebrew by running the following command:
/bin/bash -c "$(curl -fsSL https://raw.githubusercontent.com/Homebrew/install/HEAD/install.sh)"
2. Once Homebrew is installed, run the following command to update its package list:
brew update
3. Install Prometheus by running the following command:
brew install prometheus
4. Start the Prometheus server by running the following command:
brew services start prometheus
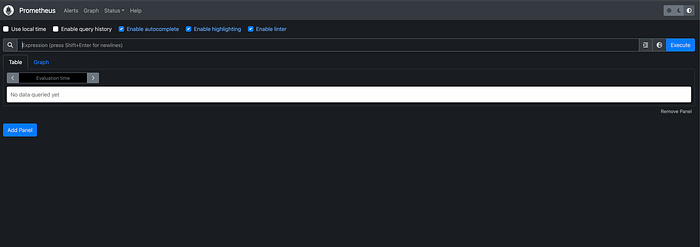
This will start the Prometheus server on port 9090, and you can access the Prometheus web UI by opening a web browser and navigating to http://localhost:9090.
If you want to stop the Prometheus server, you can run the following command:
brew services stop prometheus
And if you want to uninstall Prometheus, you can run the following command:
brew uninstall prometheus
Scrape Configuration from Atlas
In Prometheus, a “Scrape Config” is a configuration block that defines a set of targets and their associated scraping parameters.
Below is an example of a scrape config from Atlas MongoDB. We can get that by following the below steps
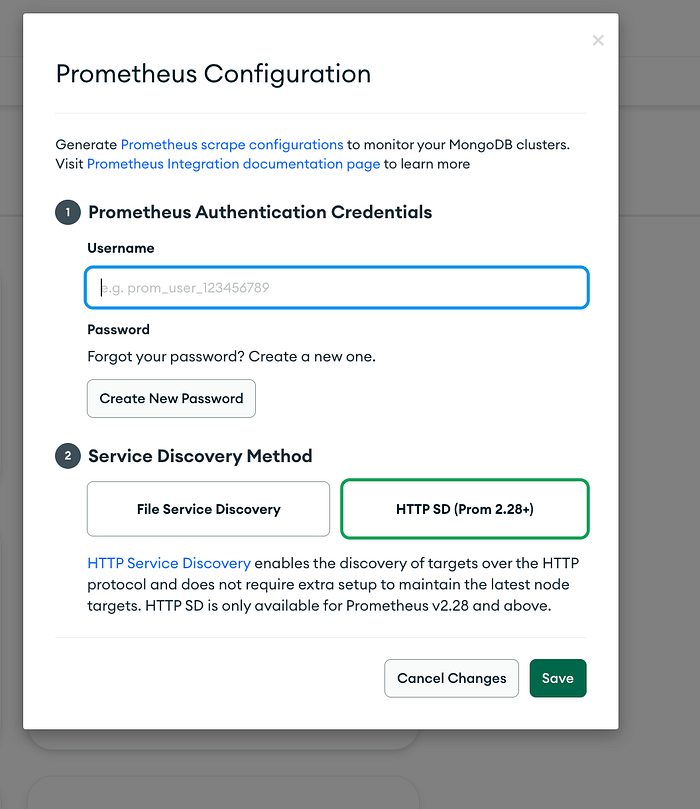
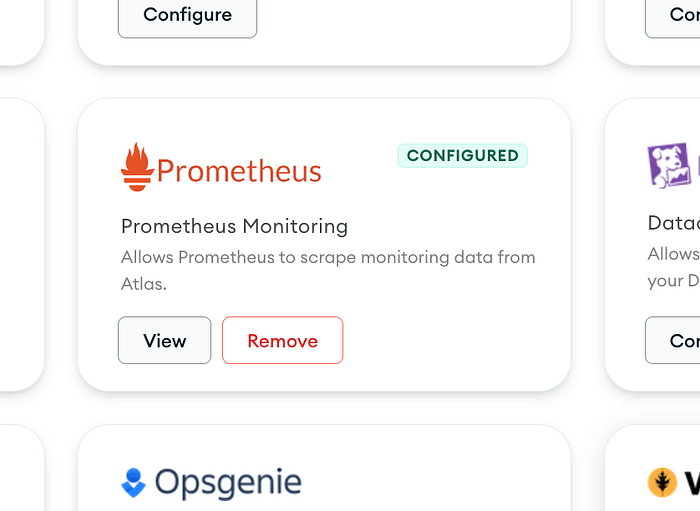
- Goto the Integration Section within your project and choose “Prometheus” Integration.
- Setup your Prometheus Authentication Credentials and
- Choose HTTP SD as the service Discovery Method
4. White list your Prometheus servers IP Address in Atlas, in this case your laptops IP Address.
5. Last copy the scrape_config section to your prometheus.yml file.
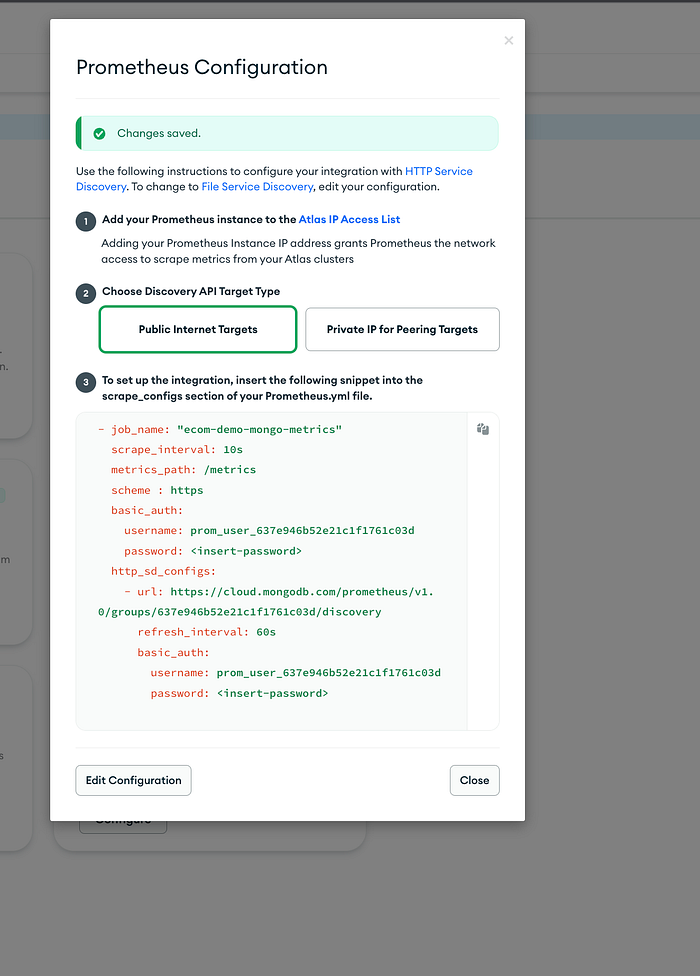
Each Scrape Config specifies the following information:
job_name: A human-readable name for the target group. This is used to identify the group of targets in Prometheus and can be used in queries and alerts.scrape_interval: The interval at which Prometheus will scrape the metrics from the target. This is specified in seconds.scrape_timeout: The maximum amount of time Prometheus will wait for a response from the target before timing out. This is specified in seconds.metrics_path: The path where the target exposes the metrics. This is typically/metricsfor HTTP endpoints.scheme: The protocol to use when scraping the target. This can be eitherhttporhttps.
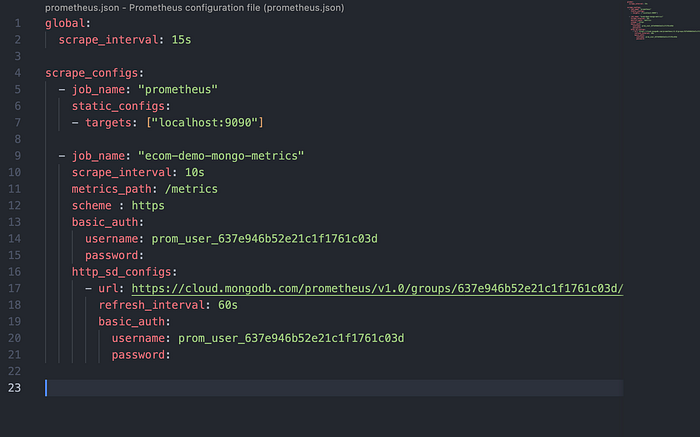
6. Once prometheus.yml has been modified, restart the prometheus server by running the following command. The file can be located at /opt/homebrew/etc/prometheus.yml
brew services restart prometheus
The prometheus server is now set up to listen to the metrics from MongoDB Atlas
Prometheus Service Discovery
Prometheus service discovery is a feature that allows Prometheus to automatically discover and monitor targets (such as servers or containers) based on pre-defined discovery mechanisms, rather than having to manually configure each target.
Service discovery allows Prometheus to scale and adapt to changes in the environment by automatically discovering new targets as they are added or removed. This makes it easier to manage and monitor large, dynamic environments.
Prometheus supports several service discovery mechanisms, including:
- Static Configurations: Prometheus can be configured with a list of static targets to monitor. This is useful for small, fixed environments where the targets do not change frequently.
- File-Based Discovery: Prometheus can monitor a list of targets specified in a file. This file can be dynamically updated by external processes, making it useful for environments where targets are frequently added or removed.
- DNS-Based Discovery: Prometheus can use DNS to discover targets. This allows it to discover targets dynamically based on changes in DNS records.
- Consul Service Discovery: Prometheus can use Consul to discover targets. Consul is a service discovery tool that provides a DNS interface for service discovery.
- Kubernetes Service Discovery: Prometheus can use Kubernetes to discover targets. This allows it to discover and monitor Kubernetes services and pods automatically.
- Amazon EC2 Service Discovery: Prometheus can use the Amazon EC2 API to discover targets in an Amazon Web Services (AWS) environment.
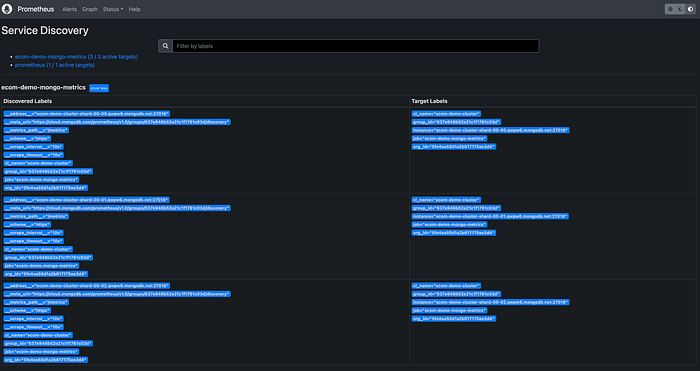
Once Prometheus has discovered targets, it uses scraping to collect metrics from those targets. This involves sending HTTP requests to the targets and collecting metrics in a specific format (usually in the Prometheus exposition format). The collected metrics are then stored in a time-series database and can be queried and visualized using Prometheus’s built-in tools or third-party tools like Grafana.
Based on the above configuration we can now see the metrics is collected from Atlas Cluster and pushed to time-series database
In the next section, we will see how we can leverage Grafana for visualizing the collected data in dashboards.
Grafana
Grafana is a popular open-source platform for data visualization, monitoring, and analytics. It allows users to create interactive and customizable dashboards, alerts, and panels, and supports a wide range of data sources, including time-series databases like Prometheus, Graphite, and InfluxDB, as well as other data sources like MySQL, PostgreSQL, Elasticsearch, and AWS CloudWatch.
It also offers a powerful alerting system that allows users to create and manage alerts based on their data, and receive notifications via email, Slack, or other channels.
Set up in Mac
You can install Grafana on your Mac using the Homebrew package manager. Here are the steps
- Follow the same steps mentioned above to install homebrew and update its package list
- Install Grafana by running the following command:
brew install grafana
3. Start the Grafana server by running the following command:
brew services start grafana
This will start the Grafana server on port 3000, and you can access the Grafana web UI by opening a web browser and navigating to http://localhost:3000.
From there, you can log in using the default username and password (admin/admin), and begin setting up your dashboards and data sources.
If you want to stop the Grafana server, you can run the following command:
brew services stop grafana
And if you want to uninstall Grafana, you can run the following command:
brew uninstall grafana
Data Source Setup in Grafana
To set up a data source in Grafana, you need to follow these steps:
- Click on the “Configuration” gear icon in the left-hand menu, and select “Data Sources”.

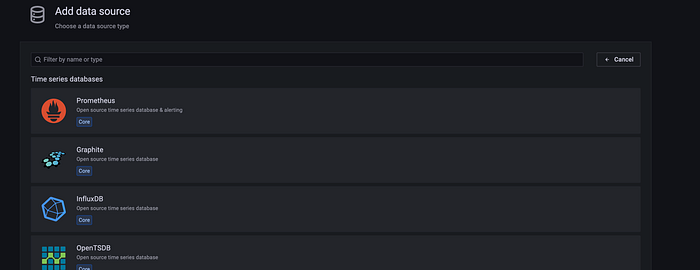
2. Click on the “Add data source” button, and select the type of data source you want to add, in this case prometheus
3. Configure the data source settings according to your data source. The specific settings will vary depending on the type of data source you’re using, but typically include the following:
Name: A human-readable name for the data source.URL: The URL of the data source.
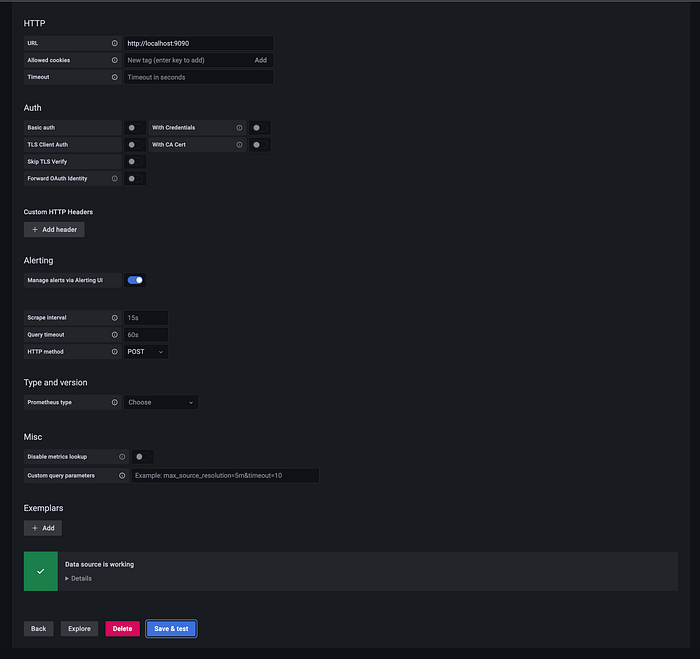
4. Once you’ve configured the data source settings, click on the “Save & Test” button to test the connection to the data source. If the connection is successful, you should see a confirmation message.
You can now use the data source in your Grafana dashboards by adding a panel and selecting the data source from the list of available data sources.
For simplicity, we will already use a Dashboard that was created for MongoDB Atlas by importing into Grafana by following the below steps.
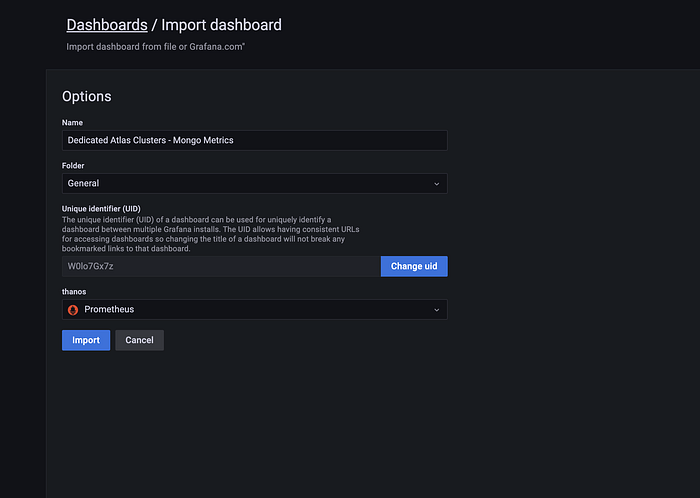
- Click on the “Dashboard” menu in the left-hand menu, and select “Import”.
- You can choose to import a dashboard from a file, or from a URL. If you have the dashboard JSON file, you can upload it by selecting “Upload .json file”. If the dashboard is available at a URL, you can paste the URL into the “Or paste JSON” field.
- Once you have selected the file or pasted the JSON code, click on the “Load” button to load the dashboard.
After importing the dashboards in Grafana automatically the dasboard should show some metrics but there seems to be a bug within Grafana, so do the below steps for previewing the data in Grafana
For a given dashboard, go to dashboard settings and modify and save the dashboard once, this will refresh the Grafana dashboard.
Dashboard Settings
- Open the Grafana web interface and navigate to the dashboard you want to configure.
- Click on the gear icon in the top right corner of the screen. This will open the dashboard settings menu.
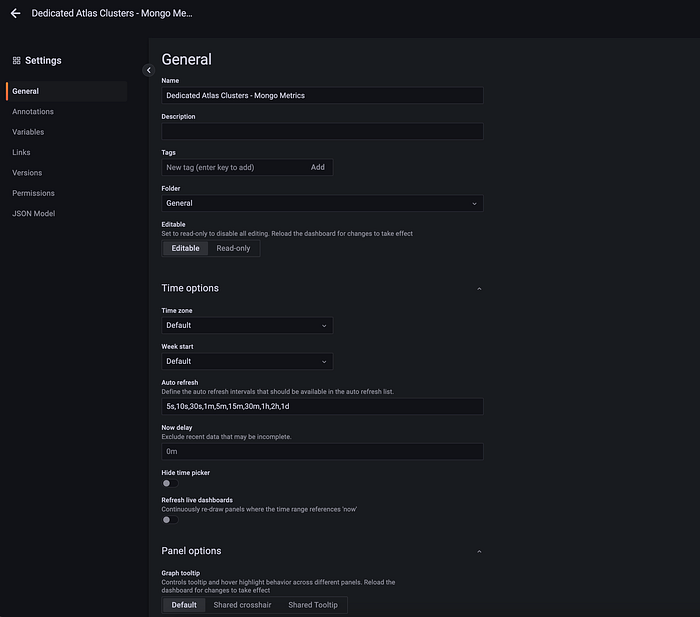
- In the dashboard settings menu, you can configure a wide range of settings for your dashboard. The settings are organized into several tabs, including General,Variables, Annotations, and more.
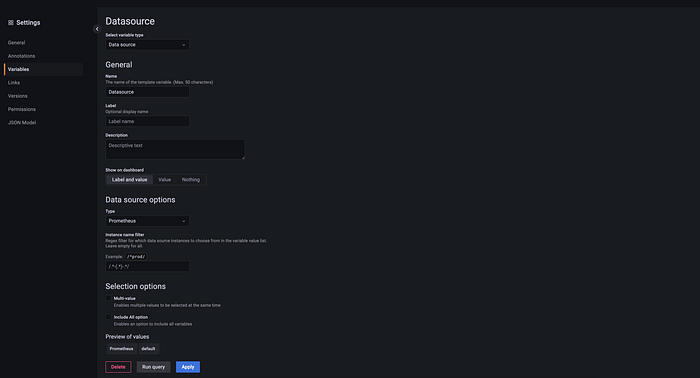
- Goto variable section, choose Datasource
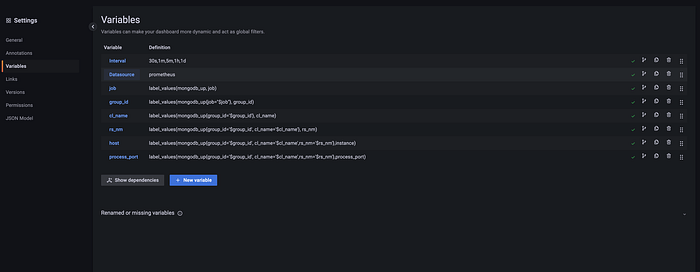
- Modify any settings and click the “Save” button to apply the changes to your dashboard.
Preview of the Dashboard
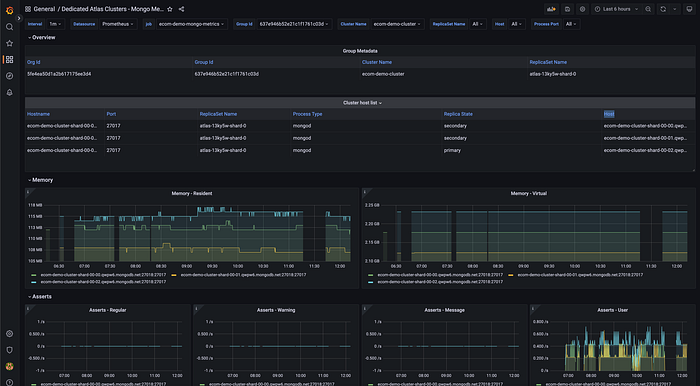
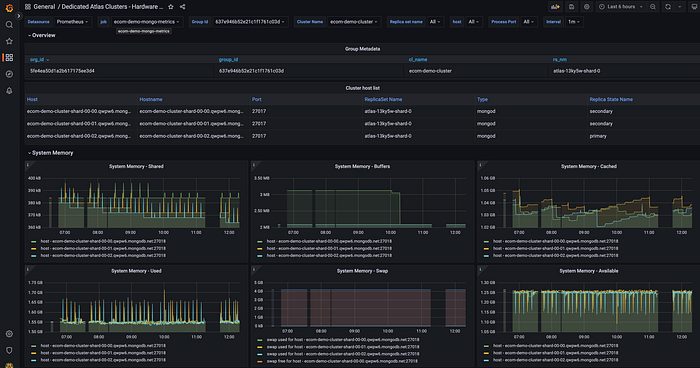
The two imported dashboards will show various metrics captured from MongoDB Atlas, as shown below.
Mongo Metrics
Hardware Metrics
That was it! Happy monitoring!